Weil der ganze Lifecycle abgedeckt ist, werden die komplett überarbeiteten „Cross-Cultural Survey Guidelines“ auch für Datenproduzent_innen interessant sein.
Dies wird insbesondere auf die Kapitel zu Paradaten, Datenharmonisierung, -aufbereitung und -vertrieb zutreffen, aber auch das umfangreiche Glossar dürfte in vielen Fällen hilfreich sein.
Hier der englische Ankündigungstext:
New and Expanded Cross-Cultural Survey Guidelines
First published in 2008, the Cross-Cultural Survey Guidelines have recently undergone a significant update and expansion (Beta release: July 2016). The new edition includes over 800 pages of content with major updates and the expansion of all existing chapters, as well as the addition of new chapters on study design, study management, paradata, and statistical analysis. More than 70 professionals from 35 organizations contributed to this effort. The senior editor was Tom W. Smith of NORC at the University of Chicago. See: http://ccsg.isr.umich.edu/index.php/about-us/contributions for a complete list of contributors.
The Cross-Cultural Survey Guidelines were developed to provide information on best practices across the survey lifecycle in a world in which the number and scope of studies covering multiple cultures, languages, nations, or regions has increased significantly. They were the product of an initiative of the International Workshop on Comparative Survey Design and Implementation (http://www.csdiworkshop.org/). The initiative was led by Beth-Ellen Pennell, currently the director of international survey operations at the Survey Research Center, Institute for Social Research at the University of Michigan.
The aim of the initiative was to develop and promote internationally recognized guidelines that highlight best practice for the conduct of comparative survey research across cultures and countries. The guidelines address the gap in the existing literature on the details of implementing surveys that are specifically designed for comparative research, including what aspects should be standardized and when local adaptation is appropriate. The intended audience for the guidelines includes researchers and survey practitioners planning or engaged in what are increasingly referred to as multinational, multiregional, or multicultural (3MC) surveys, although much of the material is also relevant for single country surveys.
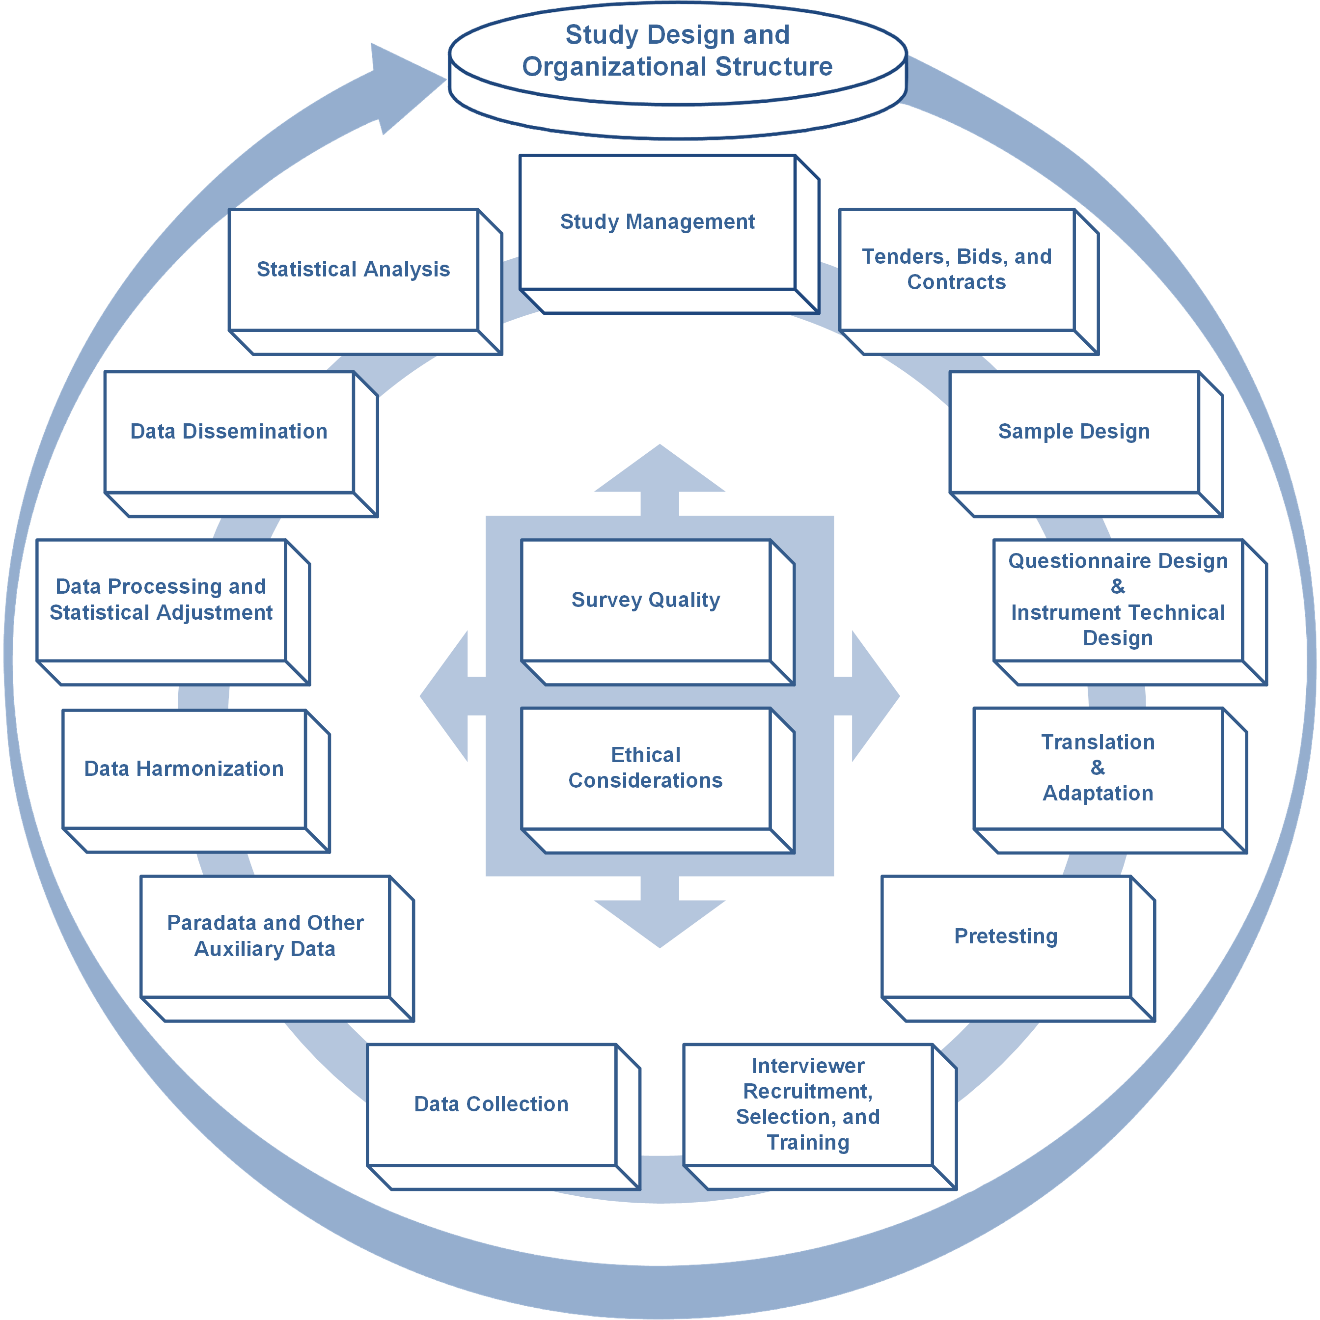
The guidelines cover all aspects of the survey lifecycle and include the following chapters: Study Design and Organizational Structure; Study Management; Tenders, Bids and Contracts; Sample Design; Questionnaire Design; Adaptation; Translation; Instrument Technical Design; Interviewer Recruitment, Selection, and Training; Pretesting; Data Collection; Paradata and Other Auxiliary Data; Data Harmonization; Data Processing and Statistical Adjustment; Data Dissemination; Survey Quality and Ethical Considerations. The guidelines can be found at: http://ccsg.isr.umich.edu. We welcome feedback and suggestions.